CORE FIELD
Welcome to CORE FIELD
CORE FIELD · SARA ROBOTICS
From plant data to a clear decision
Task-based guides, real sensor examples, and security rules for everyday work.
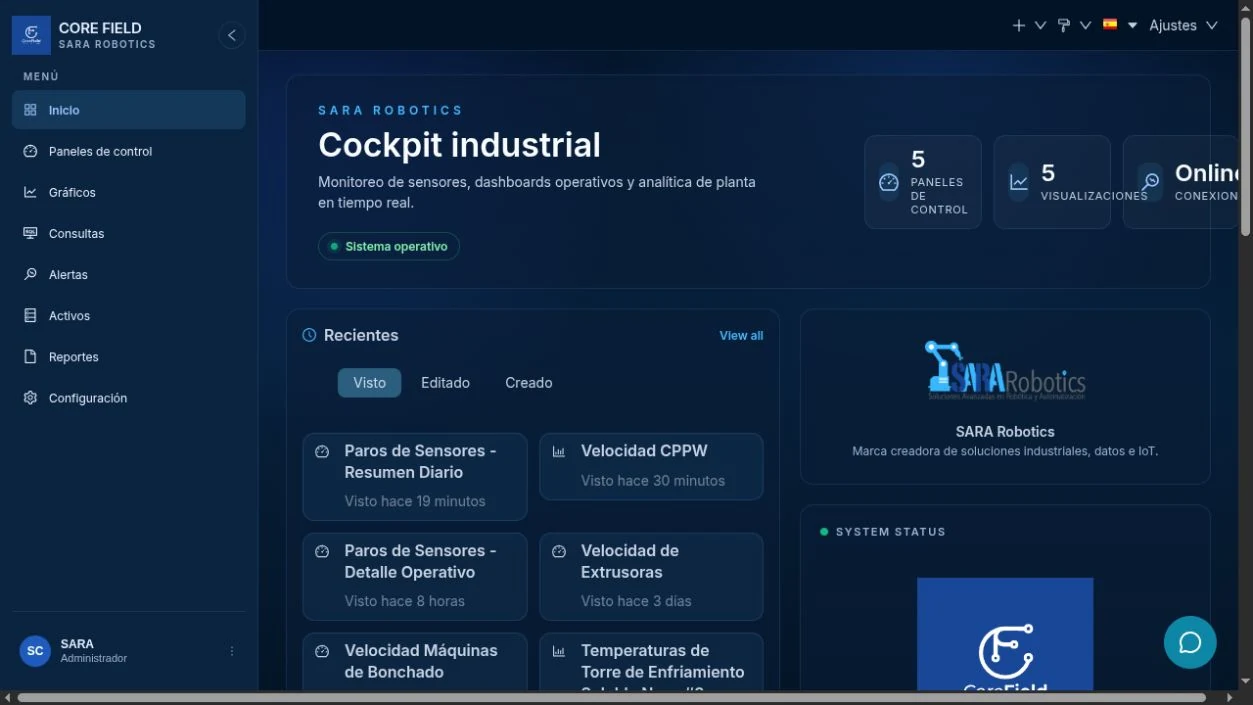
Choose a task
The rule that prevents the most mistakes
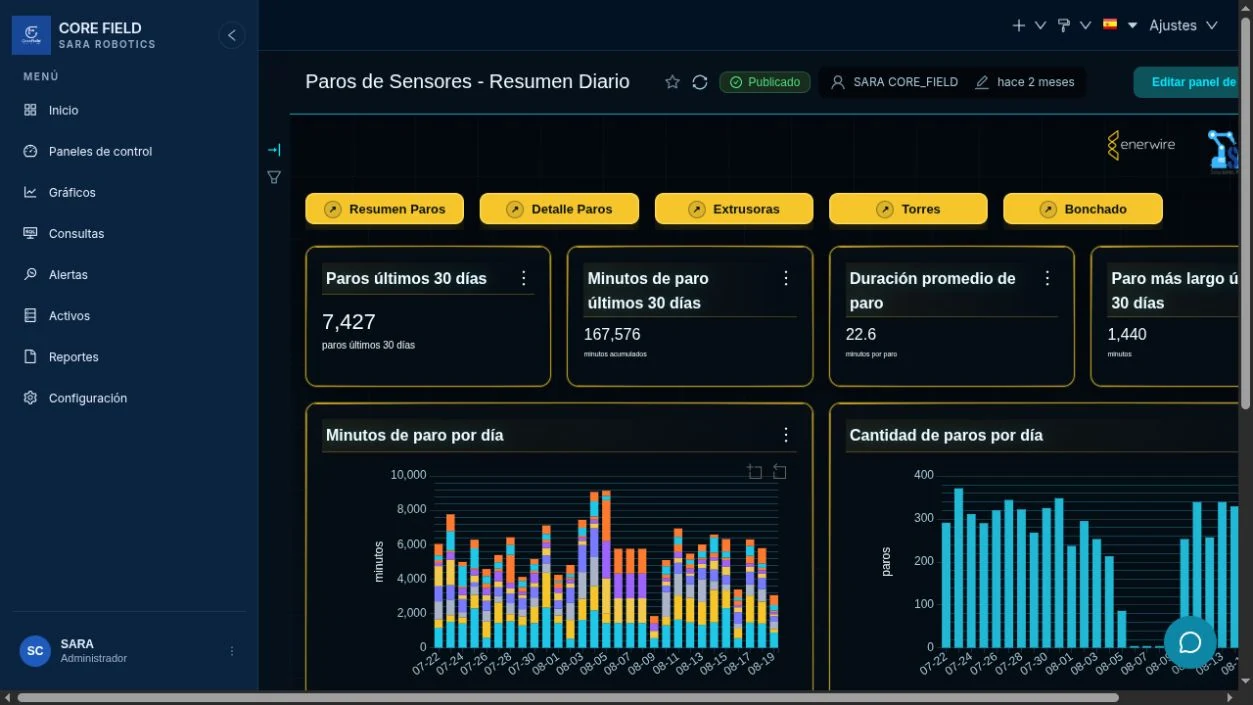
Resultado esperadoExpected result
You can open the right dashboard, recognize when its data finished loading, and choose the guide for your task.
Minimum vocabulary
- Dashboard: a screen that combines several charts.
- Chart: one visualization, such as a line, table, or big number.
- Data source or dataset: the information that feeds a chart.
- Metric: the value you want to measure, such as
CPPW. - Time grain: how readings are grouped, such as per minute.
- Range: the period to query, such as today or last week.
You do not need to memorize everything. Use search and type the action: export, share, CPPW, or alert.