

CORE FIELD
Find and read a dashboard
Dashboards are the starting point for daily work. They combine indicators, trends, and detail tables for one operation.
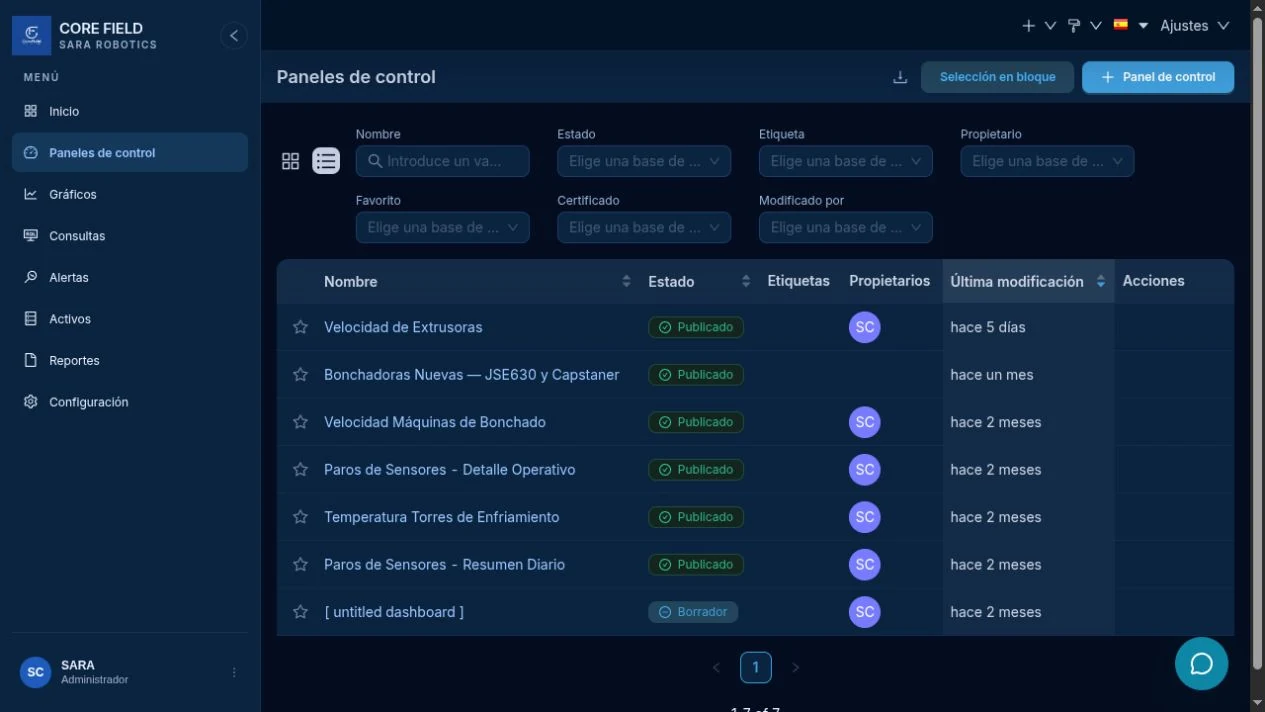
1. Find the dashboard
- Open Dashboards from the side menu.
- Type part of the name in the Name filter.
- Confirm the status is Published if the team uses it.
- Click its name.
2. Wait for the full load
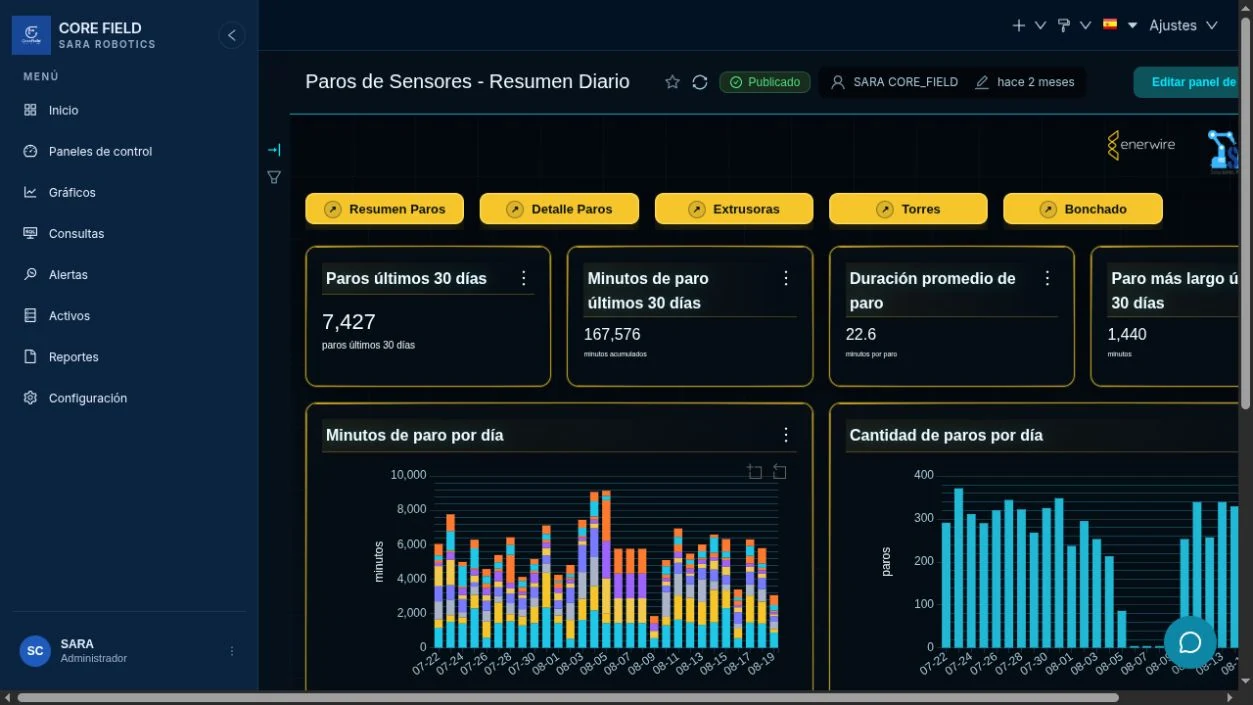
A dashboard can appear before every query finishes. Do not read it yet.
Check for:
- indicators with values instead of dashes;
- lines, bars, or rows already drawn;
- no loading messages;
- a time period that matches your question.
3. Read from general to specific
- Title and period. Confirm the operation and dates.
- Indicators. Get the overall state.
- Trends. Look for changes, spikes, or idle periods.
- Details. Move to sensor tables or charts to explain a change.
Resultado esperadoExpected result
You opened the correct dashboard and can prove that every visualization is ready before interpreting it.
If something looks empty
- Wait a few more seconds.
- Click Refresh dashboard once.
- Review the date range and remove overly strict filters.
- If one chart fails for one person, check the three access keys.