

Create and maintain a virtual dataset
A virtual dataset turns a useful query into a source that other people can find and reuse without copying SQL into every chart.
When it is worth creating one
Create one when the same preparation will support several visualizations, for example:
- hourly CPPW averages;
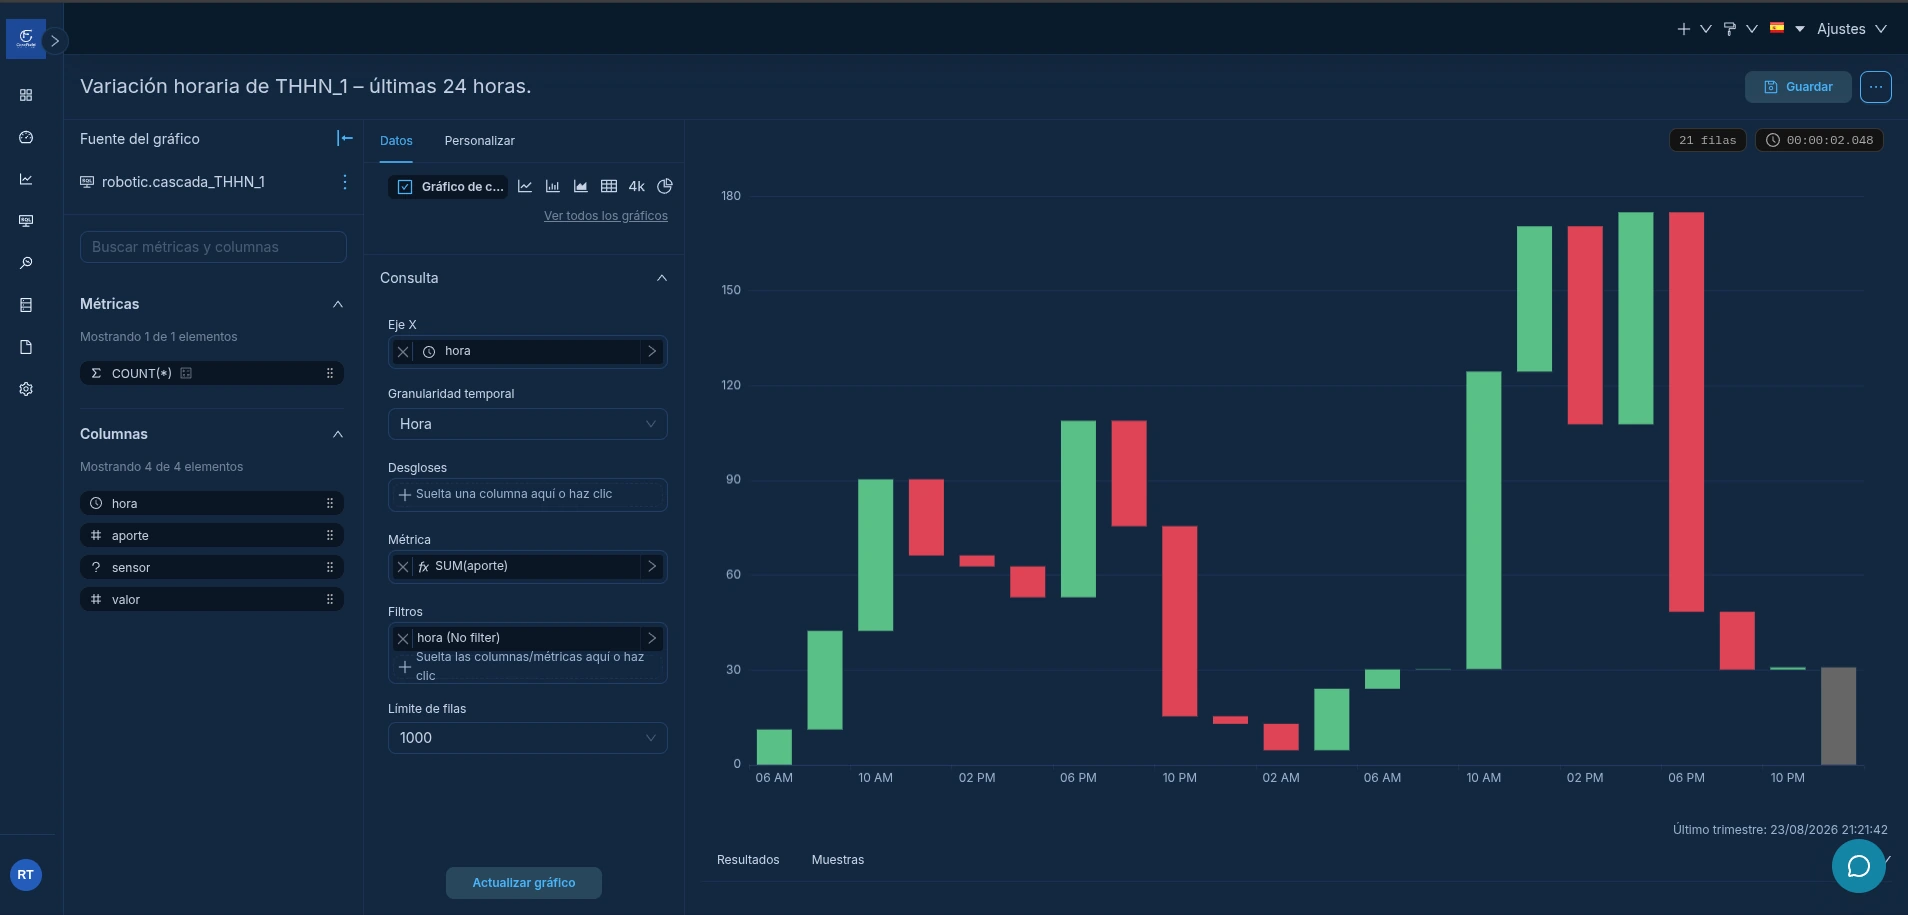
- THHN_1 changes for a waterfall;
- a join between downtime events and machine names;
- clearer names or units for the team.
Do not create one for a disposable test. Validate the query in SQL Lab first.
Save it from SQL Lab
- Run the query and verify the rows.
- Choose Save → Save as dataset.
- Select the database and schema where it will be registered.
- Use a name that explains the transformation, such as
cppw_resumen_horario. - Open the dataset in Explore.
For the waterfall example, we use robotic.cascada_THHN_1:
Prepare it for the team
Review these properties:
| Property | What to check |
|---|---|
| Description | Which question it answers and where the data comes from. |
| Owner | Who is responsible for future changes. |
| Time column | That hora or timestamp is recognized as date/time. |
| Filterable columns | Only the columns people should actually use as filters. |
| Metrics | Names and aggregations that do not encourage double counting. |
Change it without breaking content
A chart stores references to columns and metrics. If you rename or remove one, dependent visualizations may become empty.
- Identify the charts that use the dataset.
- Test the change on a copy when possible.
- Keep existing names or coordinate the migration.
- Update one chart and validate its numbers.
- Test with an account that has the team’s normal permissions.
Resultado esperadoExpected result
Another person can find the dataset, understand what it is for, and build a chart without rewriting the SQL preparation.