

Understand data sources, columns, and metrics
Before you build a chart, CORE FIELD needs to know where the data comes from and what you want to measure. A source that looks similar is not enough: it must be the right source.
Pregunta real de plantaReal plant question
What do I need to analyze CPPW speed?
- FuenteSource
robotic.sensor_data- TiempoTime
- timestamp
- MétricaMetric
CPPW- RangoRange
- the period covered by the question
The shortest useful mental model
| Concept | In plain language | Example |
|---|---|---|
| Database | The system where tables live. | Aurora MySQL |
| Schema | A logical folder inside the database. | robotic |
| Physical dataset | A table registered directly. | robotic.sensor_data |
| Virtual dataset | A saved SQL query that can be reused as a source. | robotic.cascada_THHN_1 |
| Column | A value available in each record. | timestamp, CPPW, THHN_1 |
| Metric | A rule that summarizes values. | average CPPW |
Physical or virtual
Use the physical dataset when its columns already answer your question. For example, robotic.sensor_data contains the original timestamps and sensor readings.
Use a virtual dataset when you need repeatable preparation: joining tables, reshaping data, or calculating a value such as aporte before charting it.
Recognize a source before using it
- Open Assets → Datasets if your role allows it.
- Search for the exact name.
- Check the database, schema, owner, and description.
- Open the preview and confirm that its columns match your question.
- Identify the time column before building a time series.
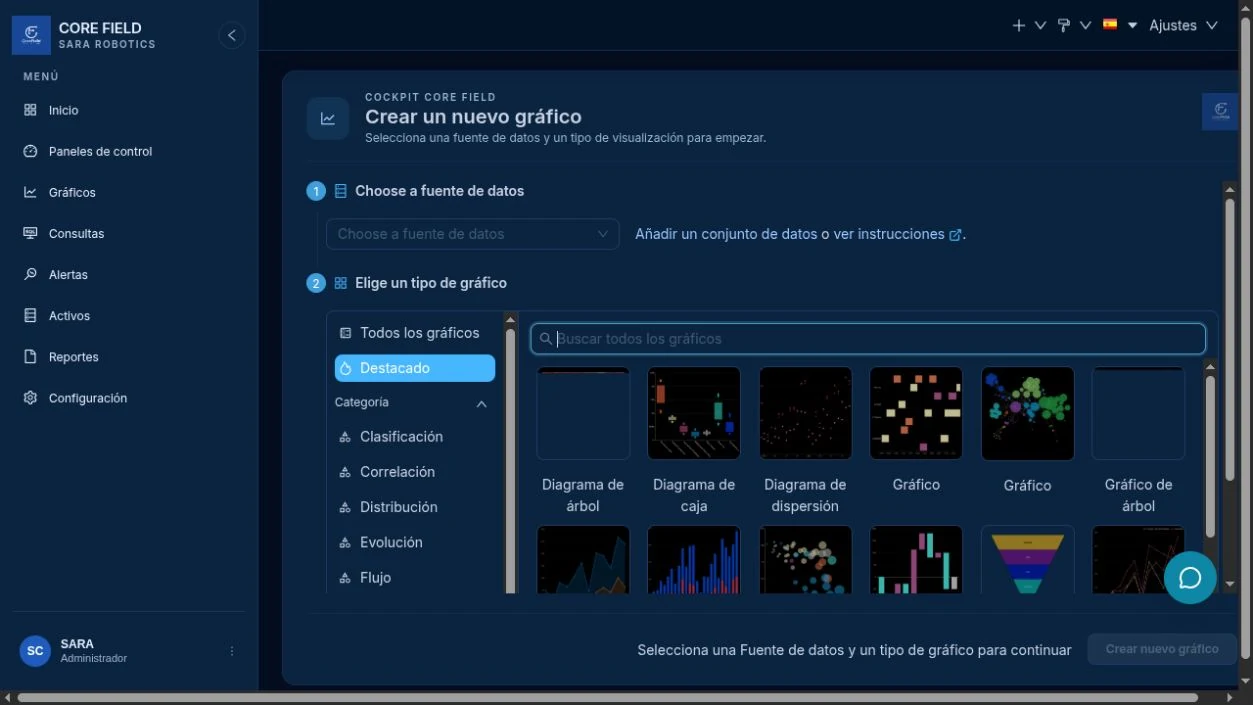
Columns and metrics are not the same
- A column answers “what value exists in each row?”
- A metric answers “how should these rows be summarized?”
For CPPW, you can use the column as input and calculate an average, minimum, maximum, or count. Those operations tell different stories, so choose the one that answers your question.
You can explain which source feeds the chart, which column represents time, and which calculation turns the rows into the value on screen.
If you need to prepare data with SQL, continue with your first safe query.