

Investigate with filters, cross-filters, and detail
A dashboard is not a static picture. Its interactions help you move from “something changed” to “where and when did it change?”
Start with the visible filter
- Open the filter bar.
- Choose a period, machine, or sensor.
- Check which charts are in the filter’s scope.
- Apply it and wait for the dashboard to finish loading.
- Read the active labels before interpreting the result.
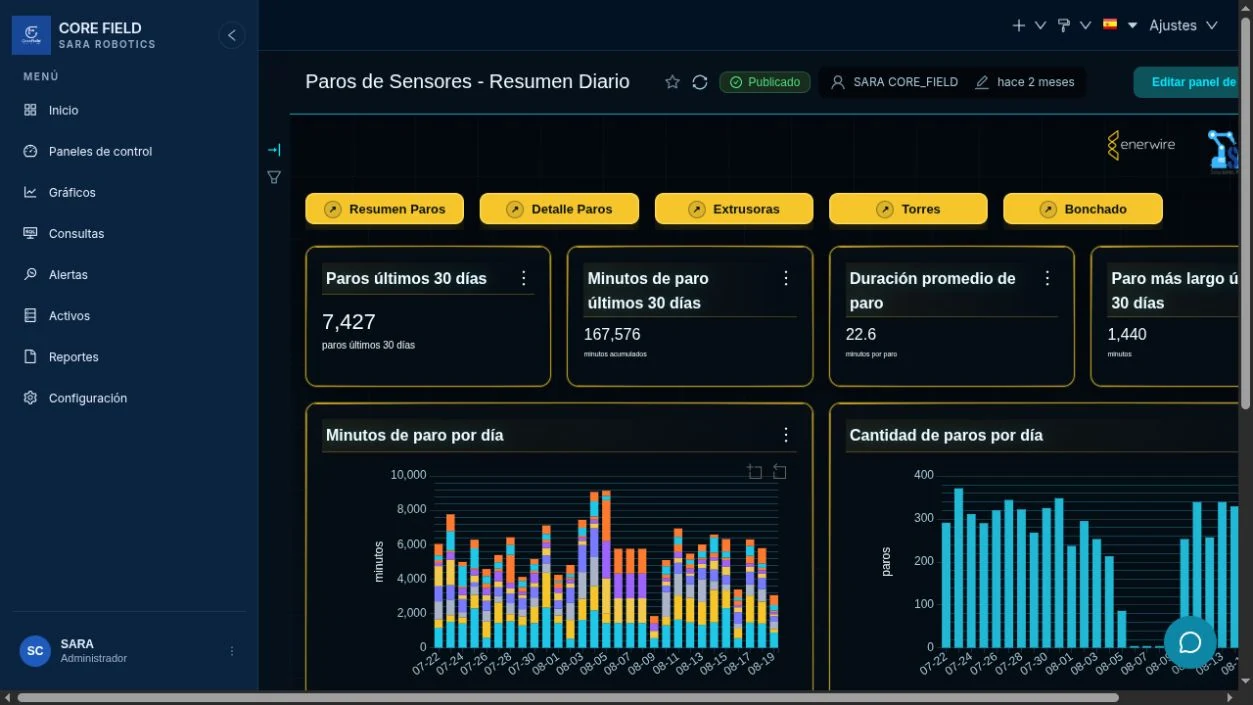
Three ways to investigate
| Action | What it does | Example |
|---|---|---|
| Native filter | Changes several charts through a dashboard control. | Show only Extruder 3. |
| Cross-filter | Uses a point or bar in one chart to filter the others. | Select a day with many stops. |
| View detail / drill | Opens rows or changes the dimension to explain a value. | See which sensors make up the total. |
Available actions depend on the chart type and its configuration. If a click does not show an option, it does not mean the data is damaged.
Keep your place
- Make one interaction at a time.
- Look at the labels or chips that remain active.
- Use Reset filters before changing the question.
- Show the filters in any screenshot you share.
- When sharing a link, check whether it preserves the state you need.
Resultado esperadoExpected result
You can explain which interaction you applied, which charts it changed, and how to return to the complete dashboard.