

Edit, organize, and publish a dashboard
This guide is for dashboard maintainers. Editing changes the experience for the whole team, so begin with a clear question and audience.
Before moving a chart
Define:
- who will use the dashboard;
- which decision it should make easier;
- which indicators need to be seen first;
- which detail can sit lower down or on another tab.
Organize the canvas
- Open Edit dashboard.
- Place general indicators at the top.
- Group related trends and comparisons.
- Use tabs for distinct journeys, not to hide clutter.
- Adjust width and height without leaving empty rows.
- Save and review outside edit mode.
Add a chart
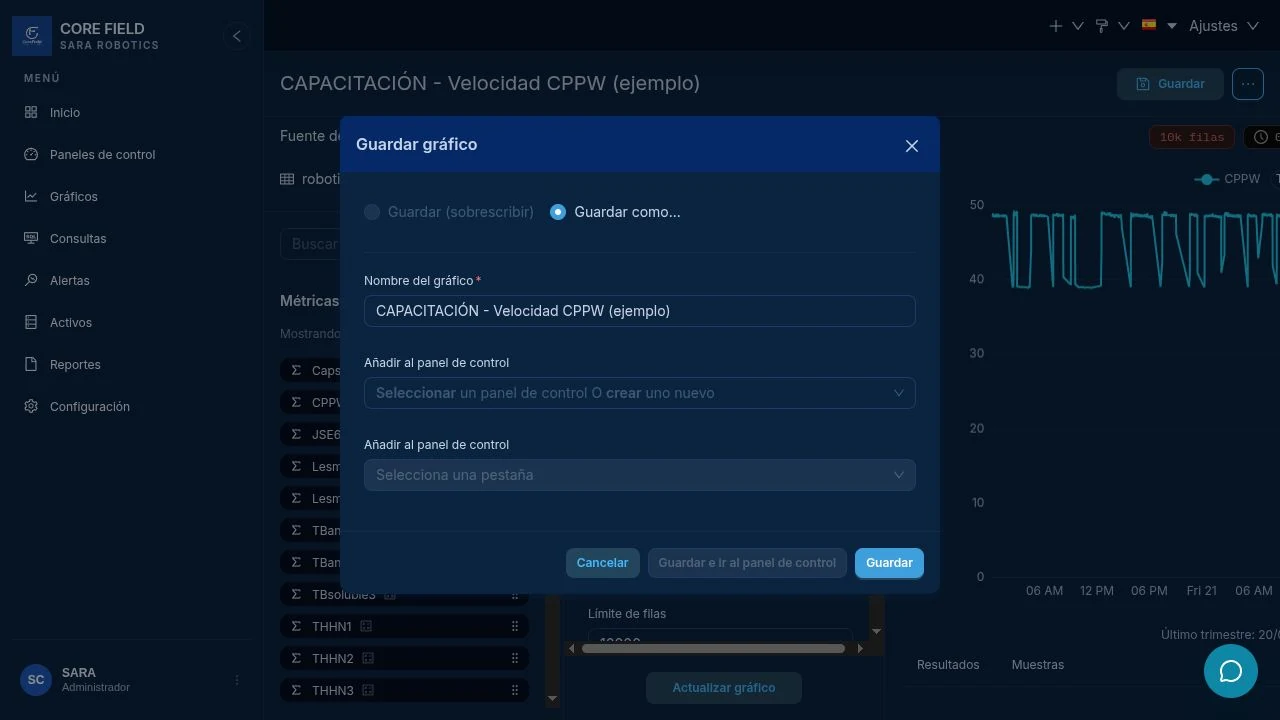
You can save it directly from Explore or drag it from the components panel while editing the dashboard.
Draft, published, and favorite
- Draft: editors and administrators use it while validating changes.
- Published: becomes available to people who also have access to its data sources.
- Favorite: the star makes it easier to find; it does not change permissions.
Data freshness
- Refresh queries again now.
- Auto-refresh repeats the load during your session; choose a reasonable interval.
- Last queried helps verify when the information was retrieved if the dashboard shows it.
Resultado esperadoExpected result
The dashboard tells a story from top to bottom, avoids large empty spaces, is published only after validation, and loads for a target user account.