

Filter, refresh, and export a dashboard
Once the dashboard is loaded, change its period, refresh the data, or download the full view.
Apply filters without losing context
- Open the filters panel.
- Choose the time range and, when relevant, a machine or sensor.
- Click Apply filters.
- Wait again for every chart to load.
- Check the active filter labels before sharing or capturing.
Dashboard-wide menu
Open the three-dot menu in the top-right corner.
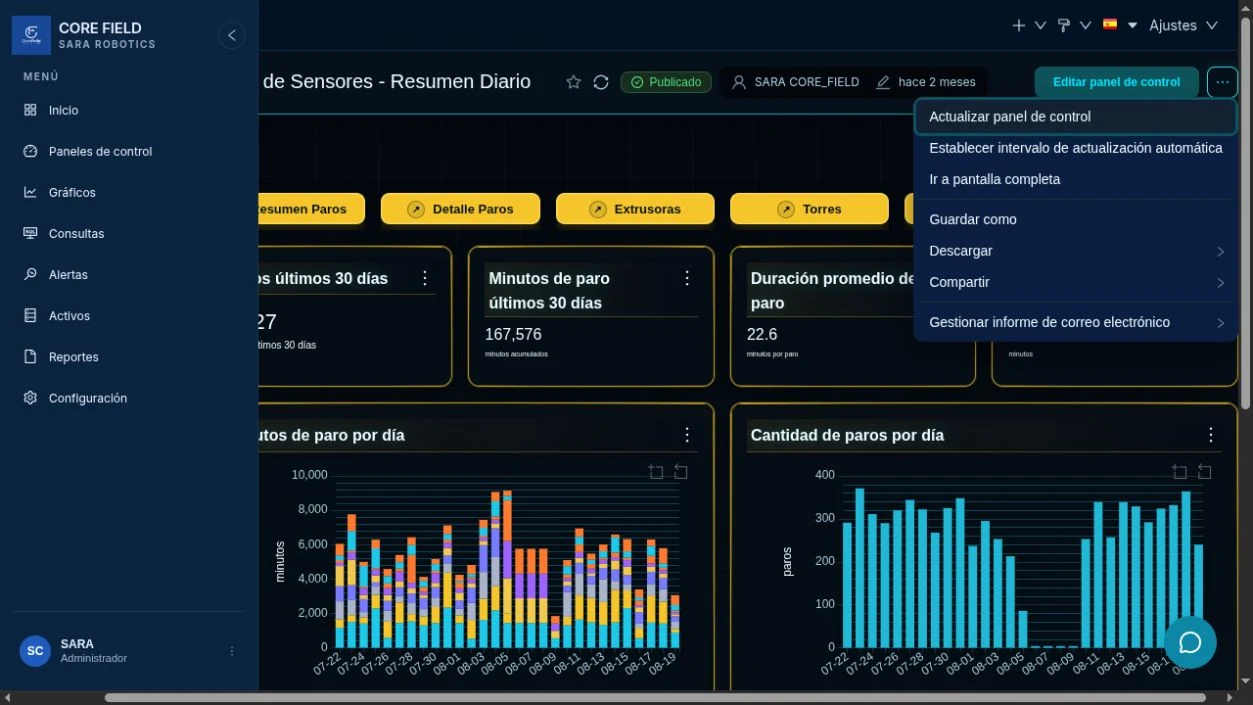
- Refresh dashboard: query the latest data again.
- Full screen: hide menus for a presentation or plant display.
- Download: generate a file for the complete dashboard.
- Share: create a link; it does not grant permissions by itself.
Download the complete dashboard
- Open ⋮ → Download.
- Choose a format.
- Wait for generation to finish before closing the tab.
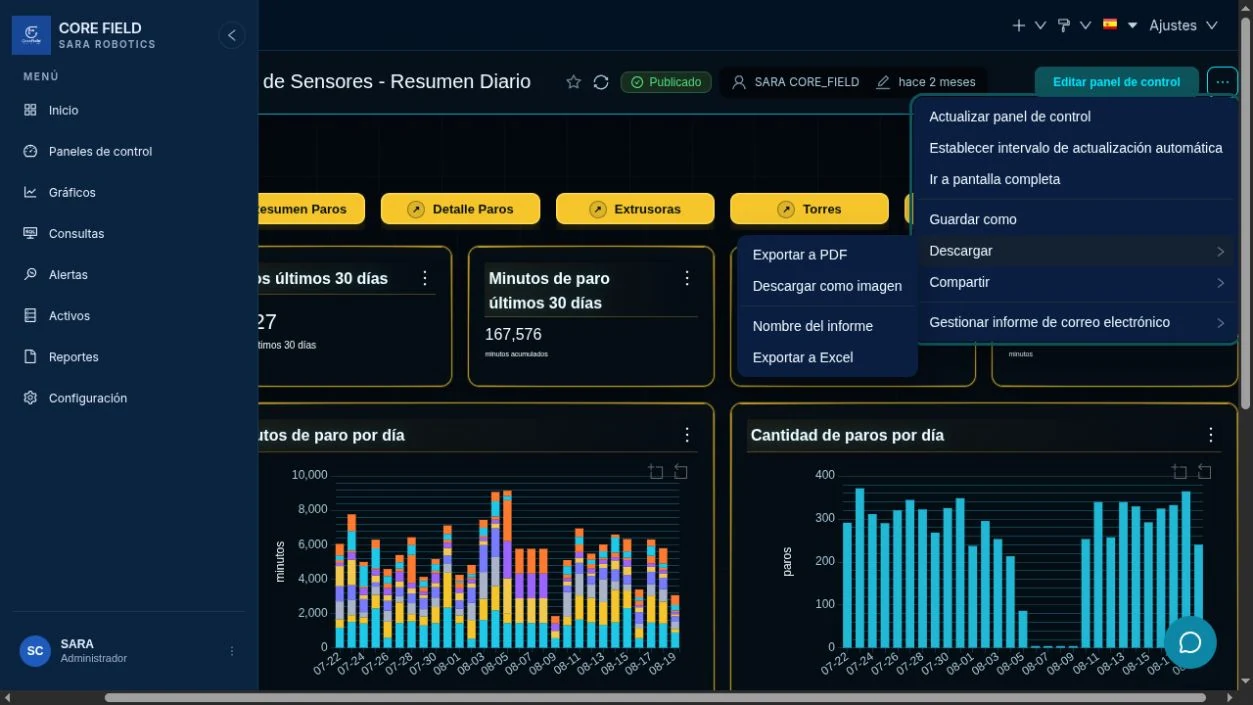
| Format | Choose it when |
|---|---|
| You want to preserve the view or attach it to a document. | |
| Image | You need a presentation, message, or visual report. |
| Excel | You want chart data in separate worksheets. |
Resultado esperadoExpected result
The file shows the same period and filters you validated on screen.